Select a Snapshot
Coastal County Snapshots
You are two clicks away from turning complex, county-level data into easy-to-understand charts and graphics. Use this tool to easily create printable handouts that help articulate your community resilience message.
Don't see your county? Find out why here.
About Coastal County Snapshots
Snapshots help people understand complex, county-level information related to coastal resilience, and use this information to ensure future safety, a healthy environment, and a vibrant economy.
Several snapshots are available (with more on the way). Looking across multiple snapshots provides a more complete picture.
Frequently Asked Questions
Tips and tricks from the experts.
Why doesn’t my county have a snapshot?
Your county may be considered an inland county, which the snapshots don’t cover, or if it is on the coast, data for that particular county may not exist.
Where do the data come from?
Data are secured from a variety of national sources, including the U.S. Census Bureau, Federal Emergency Management Agency (FEMA), and National Oceanic and Atmospheric Administration (NOAA).
When or how often is the information updated?
The snapshots are updated as national data sets are updated, and as resources permit. Ideally, NOAA will revisit each data set at least once every year and update as appropriate.
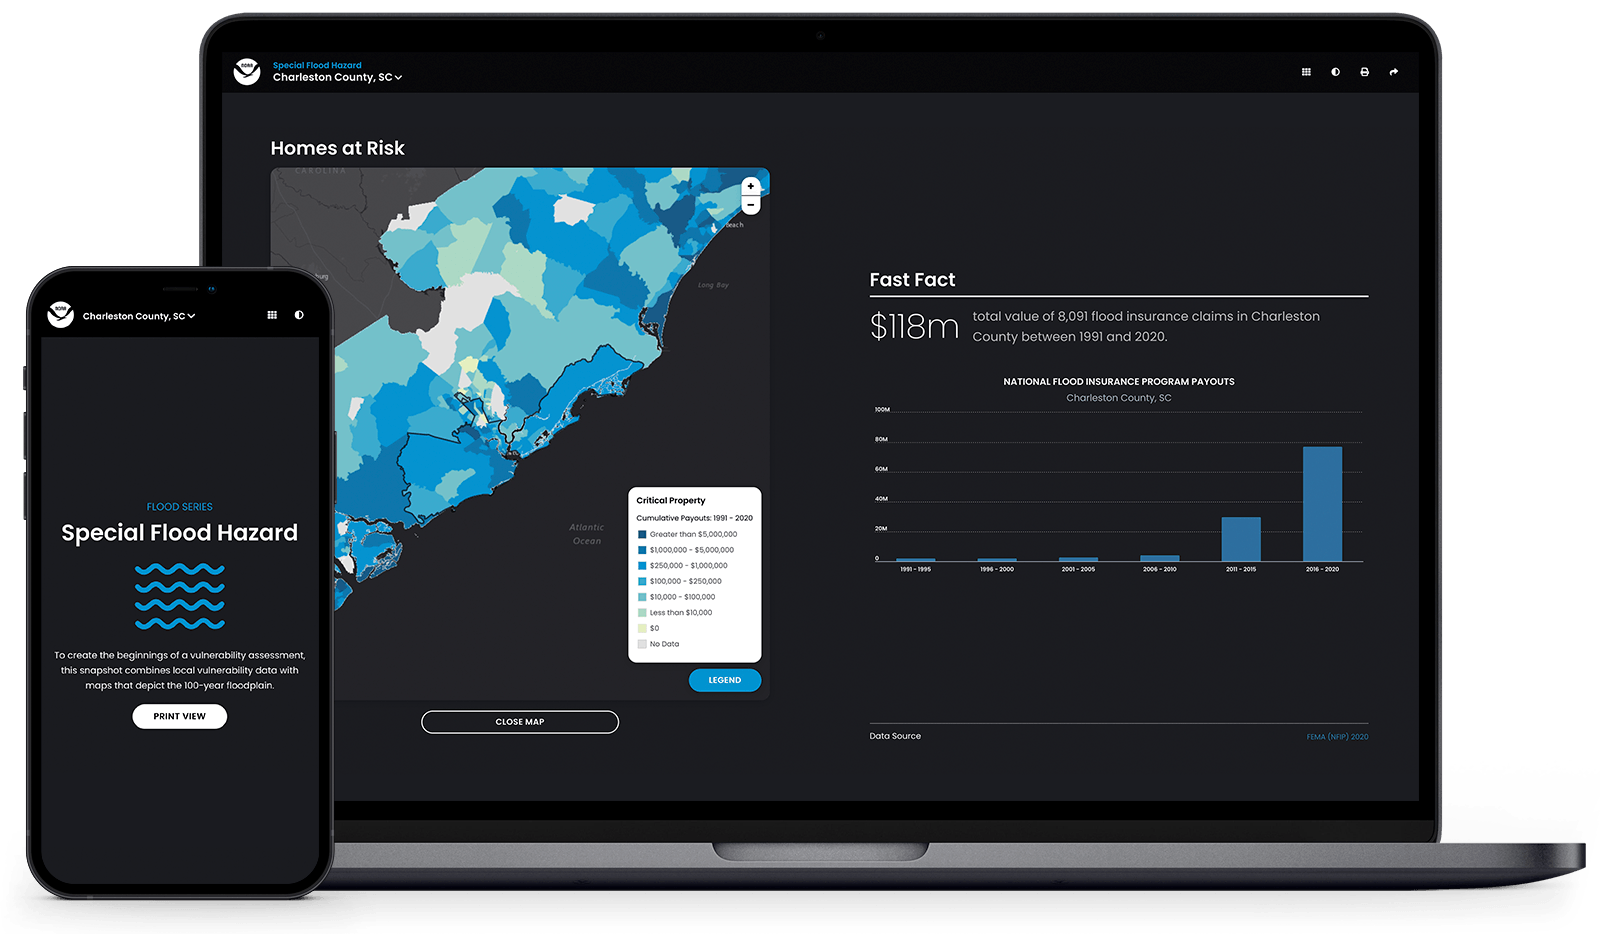
What is a Special Flood Hazard Area? How are the flood zones defined?
On a Flood Insurance Rate Map (FIRM) created by the Federal Emergency Management Agency (FEMA), a flood hazard area is identified as a Special Flood Hazard Area (SFHA). An SFHA is defined as the area that will be inundated by the flood event having a 1-percent chance of being equaled or exceeded in any given year. The 1-percent annual chance flood is also referred to as the base flood, or 100-year flood.
What is the difference between the “total economy” and the “marine economy” snapshots?
Each data set covers the coastal counties. The total economy covers all businesses in said county, while the marine economy data are focused on businesses (such as recreation and tourism, or ship and boat building) that depend on the ocean or Great Lakes. The marine economy includes six business sectors.
I spotted a mistake.
Because these data sets are national in scope, there may be errors when county-level data are extracted. But most communities have access to similar state and local data sets that can be used to conduct a risk assessment. Contact your National States Geographic Information Council state GIS representative to explore your state’s data holdings.