Issue
Understanding how drivers and pressures impact an ecosystem is critical to sustainable management. However, interpreting the myriad data can be overwhelming. Through identification and application of appropriate ecosystem indicators, management practitioners can visualize trends and make informed management decisions.
Process
To aid in the selection of appropriate indicators, a conceptual modeling framework was used to identify focal ecosystem components. The framework, as well as other statistical considerations and criteria, was used to select indicators following a thorough vetting process.
Stakeholder engagement was a key first step. The team conducted informal feedback requests with regional managers and users of the report, with an eye toward identifying deficiencies and understanding which indicators had the most direct linkages to management. Team members then took into account data accessibility and reliability issues, developing indicators based on long-standing data collection programs that can be routinely updated in future reports. Finally, the team took into consideration statistical issues, such as redundancy and sensitivity.
Among the indicators selected, several were derived from the Digital Coast resources: Total Ocean Economy, Wetland Land Use and Land Cover, and Coastal Urban Land Use. Total Ocean Economy data are collected annually by the Bureau of Labor Statistics and summarized for coastal counties as part of the National Ocean Watch program. For land use, data were downloaded from the Coastal Change Analysis Program (C-CAP) and provided information on marsh and urban trend analyses. The end result was a suite of indicators, developed to represent key components of the Gulf of America, presented in the 2017 Ecosystem Status Report Update for the Gulf of America.
Impact
The purpose of the 2017 status report is to provide a broad-level overview of the current state of the Gulf of America, with respect to recent and historical trends. The tools and data made available through Digital Coast provided a source for standardized data on land cover changes and economic movement. These indicators illustrate external impacts to the system.
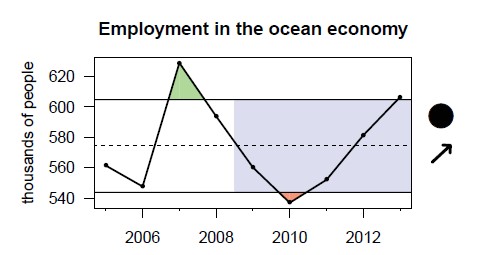
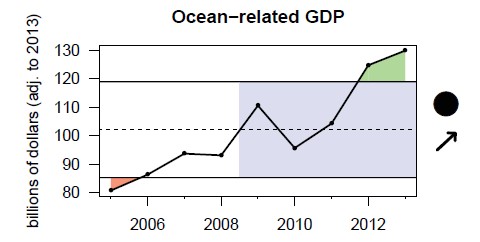
For example, there was a clear drop in regional employment and gross domestic product in 2010, the year of the Deep Water Horizon event (Figure 1). However, it should be noted that this event occurred subsequent to the economic downturn in 2008, a time when high gas prices were already putting a strain on individuals and businesses. The graphs provide a visual trend summary that will lead researchers and managers to further investigate potential cause and effect.
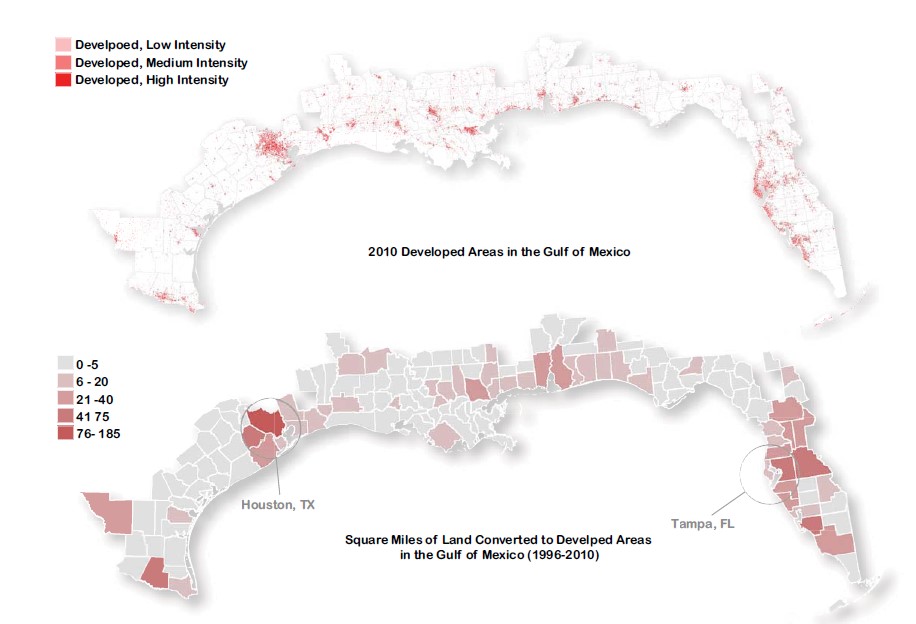
The land use change data provide a visual demonstration of the significant loss of wetland cover in Louisiana versus moderate wetland gains in the Florida panhandle (Figure 2). In Figure 3, conversion from other land cover types into developed land across the region is apparent, particularly in urban centers such as Houston, Texas and Tampa, Florida, where this change has progressed at an even faster rate. Given this type of analysis, managers can make more informed decisions, taking into account the broad suite of drivers and pressures impacting the system. (2017)


Contributors
- Office of Oceanic and Atmospheric Research Atlantic Oceanographic and Meteorological Laboratory
- NOAA National Marine Fisheries Service Southeast Regional Office
- NOAA National Centers for Coastal Ocean Science
- NOAA Office for Coastal Management
- NOAA National Marine Fisheries Service Southeast Fisheries Science Center
- University of Miami
