Overview
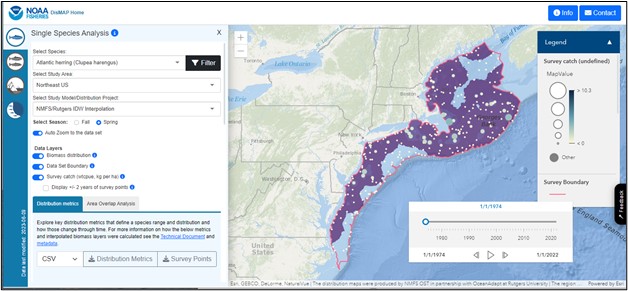
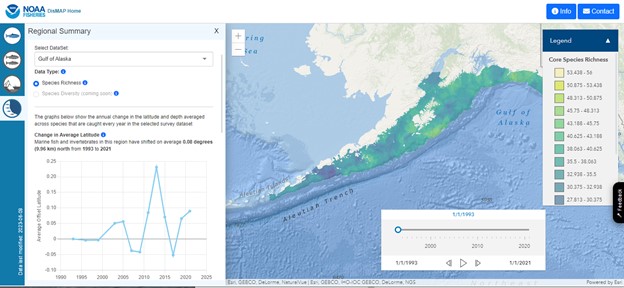
This interactive user-friendly website provides visualization and analysis tools to better track, understand, and respond to shifting distributions of marine species. It allows users to examine changes in species distribution over time by looking at location maps and graphs of key indicators (changes in latitude, depth, and range limits). Understanding how species are distributed in space and time and the factors that drive spatial patterns in distribution and abundance are central questions in ecology and important for species conservation and management.
Features
- Explore visual and numerical metrics related to species range and distribution
- Explore change in species richness and location through time
- Filter by species category (i.e., taxonomic group), region, fishery management council, or fishery management plan


