Hello!
The Analyze Tool is designed for use on desktop computers and tablets in landscape mode.
The Analyze Tool is designed for use on desktop computers and tablets in landscape mode.
Learn how to perform a detailed analysis to determine if, how, and when stormwater systems will be compromised by coastal flooding.
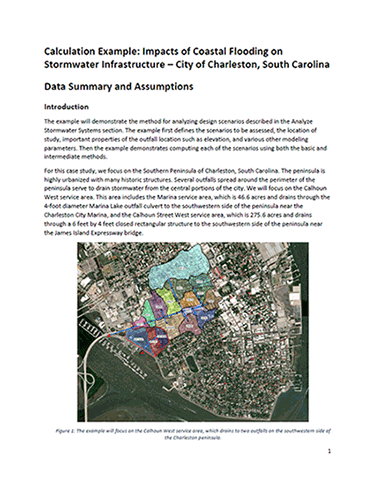
As you complete the steps for your town or city, follow along with an example of how this process was implemented for Charleston, SC: Impacts of Coastal Flooding on Stormwater Infrastructure -- City of Charleston, South Carolina.
This video will provide you with an overview of the four-step process you'll follow in this section.

As you complete the steps for your town or city, follow along with an example of how this process was implemented for Charleston, SC: Impacts of Coastal Flooding on Stormwater Infrastructure -- City of Charleston, South Carolina.


You will start with one scenario, but you should plan to develop a suite of scenarios. These scenarios should mirror the range of conditions that might occur in your community—from current flood conditions to potential future extreme events. You’ll use the scenarios to pinpoint when and where the stormwater system is at risk of being compromised.
Design scenarios should include the entire spectrum of current flood risk (low to high, defined by the probability of occurrence and the amount of impact or damage), while also taking into account changing future conditions like sea level and lake level rise, increases in extreme precipitation events, and changing population and land use. As risk increases, more impact and damage will most likely occur but the probability decreases. Extreme flooding has a relatively low probability of occurring but will have major consequences if it does.
Stormwater systems are not designed to handle extreme risk, extreme coastal water levels, such as storm surge, and extreme rainfall events, such as a 100-year rainfall. In fact, many of today’s current systems may only be designed for a 10- to 25-year rainfall event. We must assume, then, that combined extreme storm surge and precipitation events will overwhelm these systems now and potentially more in the future. Designing and building systems to handle extreme risk events is cost prohibitive.
Design scenarios should include a combination of flooding sources and adaptive actions. An iterative process should be used to tweak the input flooding scenarios and adaptation actions to determine the best scenario that addresses the flood risk and is the most cost effective.
Four scenarios representing combined effects (coastal and stormwater) are considered here. The scenarios were selected to represent the range of extreme combined flooding conditions that are likely to occur at this location. The scenarios range from conditions currently occurring to conditions that are only likely to occur in the future. A 25-year design life is assumed for these combined effects design scenarios.
Scenario 1 is defined to look at the effects of extremely high tides—the so-called king tides—on present-day Charleston. We use the highest astronomical tide (HAT) metric as a proxy for king tides. HAT is a metric reported in NOAA’s tide gauge database, which is available online for gauges around the country. In this scenario, we assume:
In Scenario 2, we look to the future. We’ll assume mean high water as the tide level, as we are interested in everyday conditions. We’ll forecast a situation 25 years from the present (2043), where the sea level has risen and the stormwater system is hit with a 10-year storm. The system in Charleston was originally designed for the 10-year storm, so the results of this scenario will isolate for us the effect of 25 years of sea level rise (SLR). Finally, we’ll include an adaptation action—tidal backflow valves—which will allow the system to continue to operate as tides rise above the outfall elevations. Scenario 2 assumptions:
In Scenario 3, we’re interested in the impact of sunny-day king-tide flooding in the future. Again, we look at 25 years from the present (2043) and include HAT to represent the king tide event. We’ll assume backflow valves are present, since the City of Charleston is currently adding dozens of valves to its system and will have completely protected the system with them within a few years. Scenario 3 assumptions:
In Scenario 4, we look at the impact of storm surge. We assume 25 years of SLR (2043), plus a 25-year storm surge. To evaluate the worst case, we use the extreme SLR forecast from NOAA, which is significantly higher in 2043 than the intermediate forecast and which was used in scenarios 1, 2, and 3. We also include seasonal and geographic variations, and a coincident 2-year, 24-hour rain event. Again, we assume tidal backflow valves protect the system. Scenario 4 assumptions:
Note: The 25-year storm surge could result from a hurricane or a strong non-tropical storm. The height of the storm surge itself is a function of the strength of the storm and the direction and speed in which it approaches Charleston.
Download the Charleston Case StudyTo learn more about each input field and see a sample process, select the Guidance links on the left.
Consider the design life of your stormwater system. What is the service life (how long the system will be used)? Combined with your starting year, this will also give you a target year for sea-level rise calculations. If you’re modeling the current year, this value will be 0.
Lorem ipsum, or lipsum as it is sometimes known, is dummy text used in laying out print, graphic or web designs. The passage is attributed to an unknown typesetter in the 15th century who is thought to have scrambled parts of Ciceros De Finibus Bonorum et Malorum for use in a type specimen book.
Select this option to calculate a coastal total water level based on a series of water-level components—such as tide, sea level rise, storm surge, seasonal variation, and so forth. This is the recommended approach.
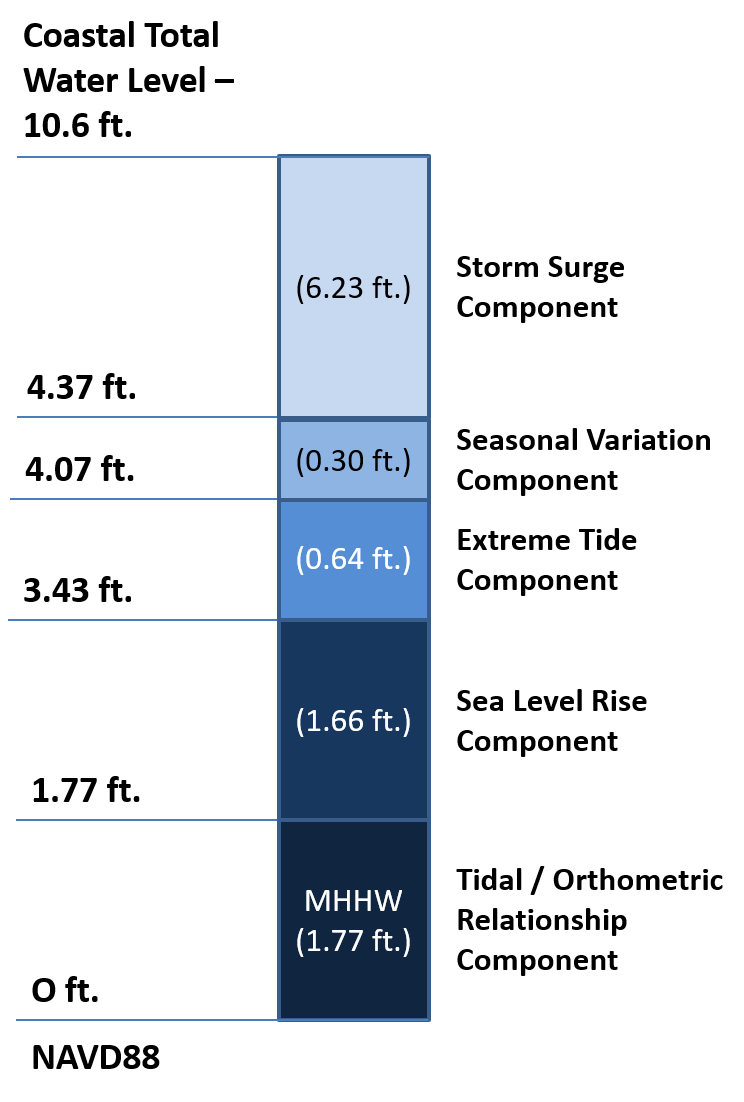
In Step 2, you will derive a coastal total water level from a series of water-level components. The example below contains all possible components. In the next screen, you will define what components you want to include in your scenario.
Select this option to set a predefined water level manually. This may be based on your community’s regulatory guidelines. For example, you may be planning for a future water level of 3 feet above a specific tidal datum (such as mean higher high water). You will need to convert this value to your chosen orthometric datum. You will select this value in Step 2, where we also provide additional details about datums.
To learn more about each input field and see a sample process, select the Guidance links on the left.
All scenarios use a tidal datum to calculate a baseline water level. This will typically be mean higher high water (MHHW), the average of the highest daily tide, observed over the National Tidal Datum Epoch (currently 1983-2001). This is a good proxy for everyday conditions.
You can optionally raise that level. This can be the highest astronomical tide (HAT), the highest tide expected to occur under average meteorological conditions in the current tidal epoch. We use the HAT as a proxy for extreme tides (king tides). HAT is higher than MHHW, but is less likely to co-occur with a major storm event.
Local or relative sea level rise is caused by many factors including vertical land motion, thermal expansion of ocean water, and ice melt. It is recommended that you always include an estimate of sea level for your target year. This is the case even if you are modeling the current year, so you can account for sea-level change from the end of the tidal epoch to the current year.
Select a sea level rise scenario based on your community’s risk tolerance. If you are unsure, consider starting with the 2022 Intermediate-High scenario. Note that there are two sets of scenarios from 2017 and 2022. These are based on Sea Level Rise Technical Reports developed by NOAA and its federal agency partners in support of the National Climate Assessment. To learn more about these reports and their associated scenarios, visit the 2022 report.
It is important to note that not all communities are expected to experience sea level rise. For example, communities in coastal Alaska may experience decreasing relative sea levels over time. For more information, visit NOAA’s Sea Level Trends website.
Surge can be caused by an offshore storm (hurricane, nor’easter, etc.) or a prolonged onshore wind event causing a tidal anomaly. If you want to include surge in your scenario, check the box and indicate a descriptor for the related surge. You may choose a 10-year surge, 25-year surge, or other timeframe—but you may wish to consider the same timeframe as your scenario. Alternatively, you may choose to indicate a surge elevation value (e.g. 3 ft above MHHW). The height of the storm surge itself is a function of the strength of the storm and the direction and speed in which it approaches.
To learn more about each input field and see a sample process, select the Guidance links on the left.
Stormwater systems may become stressed or overwhelmed when high coastal water level combines with a significant precipitation event. Do you want to include precipitation in your scenario? If so, you may want to indicate the return period for the precipitation event. Return periods estimate the probability of a given precipitation event based on historical precipitation data for your area. As such, higher return periods denote less frequent, yet more extreme precipitation events. You might consider using the return period associated with the design storm for your stormwater system, such as a 10-year or 25-year event. If your scenario stretches over a long timeframe, you may wish to consider the impacts of climate change on rainfall predictions for your area by using a higher return period (e.g., use a 50-year event instead of a 25-year event). Alternatively, you may choose to base your scenario on a historical extreme rainfall event by indicating its estimated return period, or use continuous simulation of historical precipitation. If you chose to include storm surge as an ocean-side event, consider including any inland precipitation from that storm. You can also design scenarios without inland precipitation to model future sunny-day flooding conditions.
What other potential sources would cause water flows into this catchment? Examples include dam and levee breaches, riverine flooding, and flows from other catchments.
Communities often have complex hydraulic features. In New Orleans, a complicated system of pump stations and levees reduces the risk of flooding from the surrounding ocean and Mississippi River. In Savannah, a system of berms holds back the Savannah River to prevent flooding. Communities like these should explore scenarios where features breach or malfunction, as they pose a flooding threat that can exacerbate the risk of other flood sources, like sea level rise.
These actions will reduce water flow or volume in the stormwater system. Adaptive actions may include tidal flap valves to prevent backflow, augmented seawalls, flood protection structures, tide gates, pumps, drain shafts and drainage tunnel system, deep injection wells, and community-scale green infrastructure.
Building scenarios with potential adaptive actions may allow you to assess the efficacy of different types of protective measures (which we’ll explore in the next section, “Take Action”). As such measures are implemented, you should revisit your design scenarios and, if necessary, revise your analysis.
You can also use the Assess Flood Risks section of this website to estimate a water level. In that section, you specify a coastal flood threshold—a water level elevation that must be exceeded for impacts to occur in your area. Using this value as your coastal total water level in this section is a shortcut to begin preliminary analysis of your stormwater system.
Use Assess Flood Risks to estimate a water level for your scenario.
Import your most-recent coastal flood threshold value from Assess Flood Risks. Note that this value references your orthometric datum. If you are using a different datum, you will need to use the Assess Flood Risks section, and convert to your chosen datum.
Water levels are often referenced to a tidal datum (e.g., MLLW, MHHW, or mean sea level, or MSL), but the elevation of your community’s terrestrial infrastructure is likely referenced to a (geoid-based) orthometric datum. This is the datum that you will be converting your tidal elevation to. Typically, this is NAVD88 for most areas of the coastal continental United States. In some places, local datums are used. Examples include the Great Lakes (IGLD85), Hawaii (MSL), Puerto Rico (PRVD02), and U.S. Virgin Islands (VIVD09).
In this step, you will derive a coastal total water level from a series of water level components. The example below contains all possible components - the components you will define in the next screen are based on the scenario you defined in Step 1.
To learn more about each input field and see a sample process, select the Guidance links on the left.
Mean higher high water (MHHW) is the average of the highest daily tide, observed over the National Tidal Datum Epoch (currently 1983-2001). This is a good proxy for everyday conditions.
Water levels are often referenced to a tidal datum (e.g., MLLW, MHHW, or mean sea level, or MSL), but the elevation of your community’s terrestrial infrastructure is likely referenced to a (geoid-based) orthometric datum. This is the datum that you will be converting your tidal elevation to. Typically, this is NAVD88 for most areas of the coastal continental United States. In some places, local datums are used. Examples include the Great Lakes (IGLD85), Hawaii (MSL), Puerto Rico (PRVD02), and U.S. Virgin Islands (VIVD09).
To learn more about each input field and see a sample process, select the Guidance links on the left.
Report your tidal component referenced to your chosen orthometric datum (such as NAVD88).
You may have a local source for this information. If so, those data may be most locally applicable for your analysis. You can also use nationally available data. NOAA’s Center for Operational Oceanographic Products and Services (CO-OPS) maintains ocean-observing infrastructure, including more than 200 permanent stations on the U.S. coasts and Great Lakes. These stations provide historic and real-time tides, water levels, currents, and other coastal oceanographic and meteorological information.
To determine the tidal/orthometric relationship from this national network, follow this example process:
Alternatively, you can use VDATUM to vertically transform geospatial data among a variety of tidal, orthometric, and ellipsoidal vertical datums.
Learn more about datums here.
You have chosen to model extreme tide for your scenario. To do this, consider adding highest astronomical tide (HAT). HAT is the highest tide expected to occur under average meteorological conditions in the current tidal epoch. We use HAT as a proxy for extreme tides (king tides).
Follow this example process to determine highest astronomical tide for your location:
You should always model for sea level change in your scenario. This is necessary even if you’re modeling the current year, as many of the common sea-level rise scenarios start from a base year of 2000.
There are two example processes given to determine the amount of sea level change that is expected to be experienced at different coastal locations. Both will provide the same information, but the NOAA Sea Level Rise Viewer is generally easier to use.
Example Process using NOAA’s Sea Level Rise Viewer:
Example Process using U.S. Army Corps of Engineers (USACE) Sea-Level Curve Calculator:
Sea levels vary with the seasons. The average seasonal cycle is caused by regular fluctuations in coastal temperatures, salinities, winds, atmospheric pressures, and ocean currents. The variability in these factors is locationally specific, which results in certain communities experiencing a greater range of variation than others.
For stormwater analysis and design purposes, we can apply the greatest increase in coastal water levels associated with seasonal variations.
To be conservative, you should include this component. If you do not wish to account for seasonal variation, enter 0 feet/meters.
Example Process using NOAA’s Tides and Currents website:
Storm surge can be calculated using a statistical approach or by using published results (for example, coastal stillwater elevations published in a FEMA flood study), which yield a surge height for a specific return period.
Example statistical approach using NOAA’s Tides and Currents website:
NOTE:The vertical datum associated with your storm surge value is critically important to understanding how to incorporate this water level component into the coastal total water level derivation. The example above has a MHHW tidal datum reference (e.g., 3.2 ft MHHW). If you defined MHHW as your tidal datum earlier in the analysis, then all you need to do is report the numerical value given (e.g., 3.2 feet), as it has the same tidal reference datum. Since you already defined MHHW as your baseline tidal component in the first parameter, you will not need to include it again here. Doing so would result in your baseline tidal component being double counted in your coastal total water level calculations, and your values being higher than expected.
But what if your storm surge value has a different vertical datum reference? For example, many of the coastal stillwater elevations published by FEMA have an orthometric datum reference (e.g., NAVD88). Here, you’ll want to convert your surge elevation from the given vertical datum to your chosen tidal datum before including it in your coastal total water level derivations. The methods presented in Parameter 1 will help you do this.
Wave setup is the time-averaged change in water level due to the presence of breaking waves. It can increase water level during a storm event. If empirical tide gauge data were directly used to determine storm surge, then wave setup is already included in your value. Otherwise, consider adding an estimate for wave setup. To learn more, see this FEMA resource.
Use this field for any additional components of your coastal total water level that are not accounted for in the above items. For example, if vertical land motion is an issue in your community, include that number (rate times number of years) here.
Wave runup is defined as an increased water level and hydrodynamic force caused by broken waves as they run up the shore before their energy is dissipated by friction and gravity. There are numerous small-scale factors that can affect the amount of wave runup at a given location, including the slope and materials of the shoreline. Some of this information can be obtained from coastal engineering studies.
In the absence of location-specific information on wave runup, you can use an engineering rule-of-thumb assumption of 10 percent of the maximum stillwater level. We apply this by multiplying the stillwater coastal total water level by a factor of 0.1 and adding the resultant value to the stillwater elevation.


An important note is the role of adaptation actions in this analysis. If the community decides to include tidal flap valves, for example, the stormwater system might be able to manage the rainfall without flooding, even as high tide is occurring. Of course, in this case, the stormwater system would act as a storage system instead of a conveyance of stormwater; when the system becomes filled with rainwater, flooding will occur.
In this basic scenario-driven analysis, we will start by estimating the flow through the system from rain sources. Next, we’ll estimate the inflow of water from an overtopping event at its maximum level. The system has a maximum flow rate, which is typically determined by evaluating the rainfall-runoff flow rate for a storm. For example, if the system in the scenario we’re evaluating was designed for the 25-year, 24-hour storm, then we could use the method outlined in the first step to evaluate the maximum flow rate the system can handle.
Once we know the maximum flow rate, we add the flow from overtopping and the flow from the design-scenario storm and compare the total to the maximum flow rate of the system to determine if the system is overwhelmed by the scenario.
This method will guide you through a process to estimate the total flows into and out of a catchment, which you will then compare to an estimated capacity. If the net flows within the catchment exceed the estimated capacity, then it can be assumed that your system is overwhelmed.
Questions that this level of analysis can answer:
Limitations of this level of analysis:
This method will provide general guidance that can be used to apply the coastal total water level derived during Step 2 to an existing stormwater model.
Questions that this level of analysis can answer (in addition to the questions posed above):
Lorem ipsum, or lipsum as it is sometimes known, is dummy text used in laying out print, graphic or web designs. The passage is attributed to an unknown typesetter in the 15th century who is thought to have scrambled parts of Ciceros De Finibus Bonorum et Malorum for use in a type specimen book.

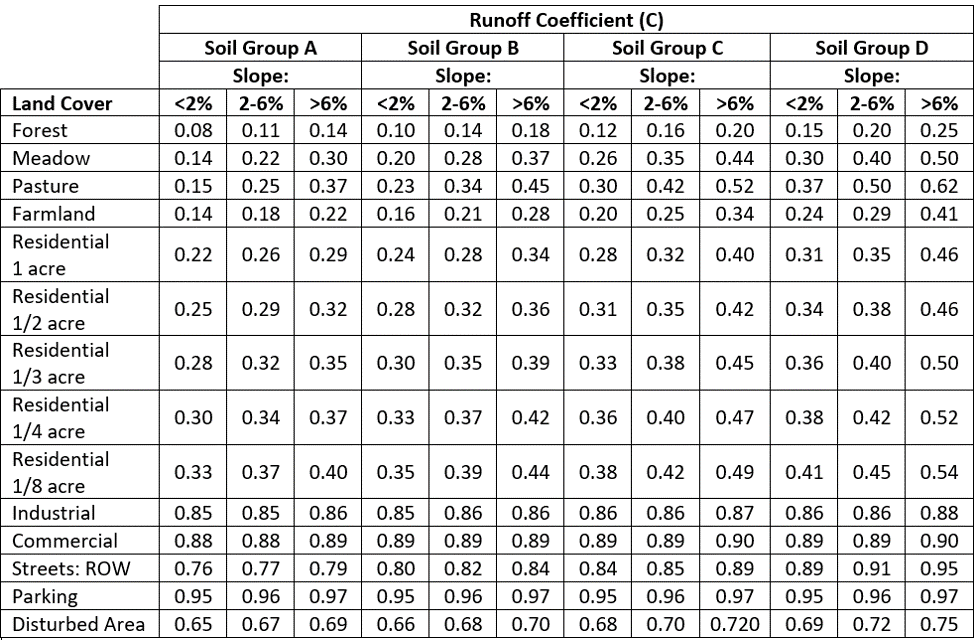
Rainfall runoff is estimated using the rational formula, Q = CIA, where Q is the stormwater flow rate caused by rain at intensity, I, over an area A. The runoff coefficient, C, is determined by the type of land cover, where higher coefficients imply impervious areas such as inner cities and lower coefficients imply high degrees of perviousness such as rural areas.
The runoff coefficient depends on the soil type, slope, and land use in your catchment area.
Soil type: Use the Model My Watershed tool (https://modelmywatershed.org/) to identify the breakdown of soil types in your community. Assume your community has the majority soil type indicated.
Slope: Estimate your community’s slope as it pertains to the following categories:
Land Cover: Use the Model My Watershed tool (https://modelmywatershed.org/) to identify the land cover types within your catchment area.
Use the tables below to identify your runoff coefficient (c) based on the soil, slope, and land cover values. Note that the land cover types that you obtained from the Model My Watershed tool may not directly match what is in these tables.
Rainfall intensities can be obtained from NOAA’s Precipitation Frequency Data Server website ( https://hdsc.nws.noaa.gov/hdsc/pfds/index.html).
The best way to estimate the area of the selected stormwater catchment is to look to your community’s GIS or Public Works department, which usually has a GIS layer depicting the catchments for the entire stormwater system.
If a GIS layer is unavailable, you can also use the Model My Watershed tool ( https://modelmywatershed.org/) to delineate the catchment yourself.
Detailed knowledge of your stormwater system and its operation are essential in correctly defining the service area (A), as a disparity between mapped catchment areas and service areas is common.
Overtopping flow can be estimated using the Weir Equation, Q=CLH^1.5, where Q is the peak flow (cfs), C is the weir coefficient, L is the overtopping length in feet, and H is the overtopping head in feet.
This is the length of the coastal-facing portion of the service area along the lowest grade elevation. This is most often obtained from a survey or GIS-derived calculation.
This is derived by subtracting the lowest coastal-facing grade elevation from the coastal total water level.
The weir coefficient is a dimensionless value that is dependent on the geometric properties of the weir formed during an overtopping event. The standard weir coefficient for concrete walls is 2.65. More information and guidance on weirs is available through this U.S. Geological Survey publication: https://pubs.usgs.gov/wsp/0200/report.pdf

Once again, we look to the rational equation (Q = CIA, where Q is the stormwater flow rate caused by rain at intensity, I, over an area A) to estimate the capacity of the catchment. The same values for the Runoff Coefficient (C) and Area (A) can be applied from the rational equation used to derive precipitation-based runoff flows earlier in the process. However, for rainfall intensity (I), you’ll want to use a value that is associated with the design capacity for the stormwater system.
For example, if the system was designed for a 25-year, 24-hour storm event, then you’ll want to obtain the associated intensity for this event from from NOAA’s Precipitation Frequency Data Server website ( https://hdsc.nws.noaa.gov/hdsc/pfds/index.html), and plug it into the rational equation to determine the theoretical catchment capacity.
There are many software packages available to simulate dam breach, such as the U.S. Army Corps of Engineers’ HEC-RAS 2D. These packages allow you to include the dam within your river model. Also, there are some empirical equations relating to the amount of storage of height to peak breach and outflow.
The links below will point to documents that outline considerations for more advanced topics, such as modeled coastal water levels, groundwater impacts, and future precipitation regimes.