Fast Facts / Marine Economy
Marine Economy
The term “marine jobs,” used below, covers the U.S. oceans and Great Lakes and is based on the most recent data available (2022) from the Marine Economy Satellite Account data set, a joint project between NOAA and the U.S. Bureau of Economic Analysis.
2.4 Million Jobs
The marine sector provides 2.4 million jobs annually.
$476 Billion in Goods and Services
Annually, the marine economy contributes $476 billion in gross domestic product.
$777 Billion in Sales
In 2022, the marine economy produced $777 billion in sales—significantly more than arts, entertainment and recreation, utilities, or data processing and internet publishing.
Yearly Growth
In 2022, the marine economy saw a 1-percent growth in its contribution to GDP and a 2.3-percent increase in sales. The ship and boat building sector exhibited the largest growth, increasing by 14.7 percent, or $2.5 billion.
Good-Paying Jobs
Private marine industries with some of the highest paid jobs include utilities (average $200,000 annually); information (average $156,000 annually); mining (average $142,000 annually). In comparison, the average annual salary within the marine economy is $85,000.
Sales
The following list demonstrates the annual gross output (sales; inflation adjusted) for the 10 marine sectors:
- Tourism and recreation – $220 billion
- National defense and public administration – $194 billion
- Offshore minerals – $66 billion
- Transportation and warehousing – $56 billion
- Living resources – $31 billion
- Ship and boat building – $20 billion
- Utilities – $15 billion
- Research and education – $12 billion
- Professional and technical services – $8 billion
- Construction – $7 billion
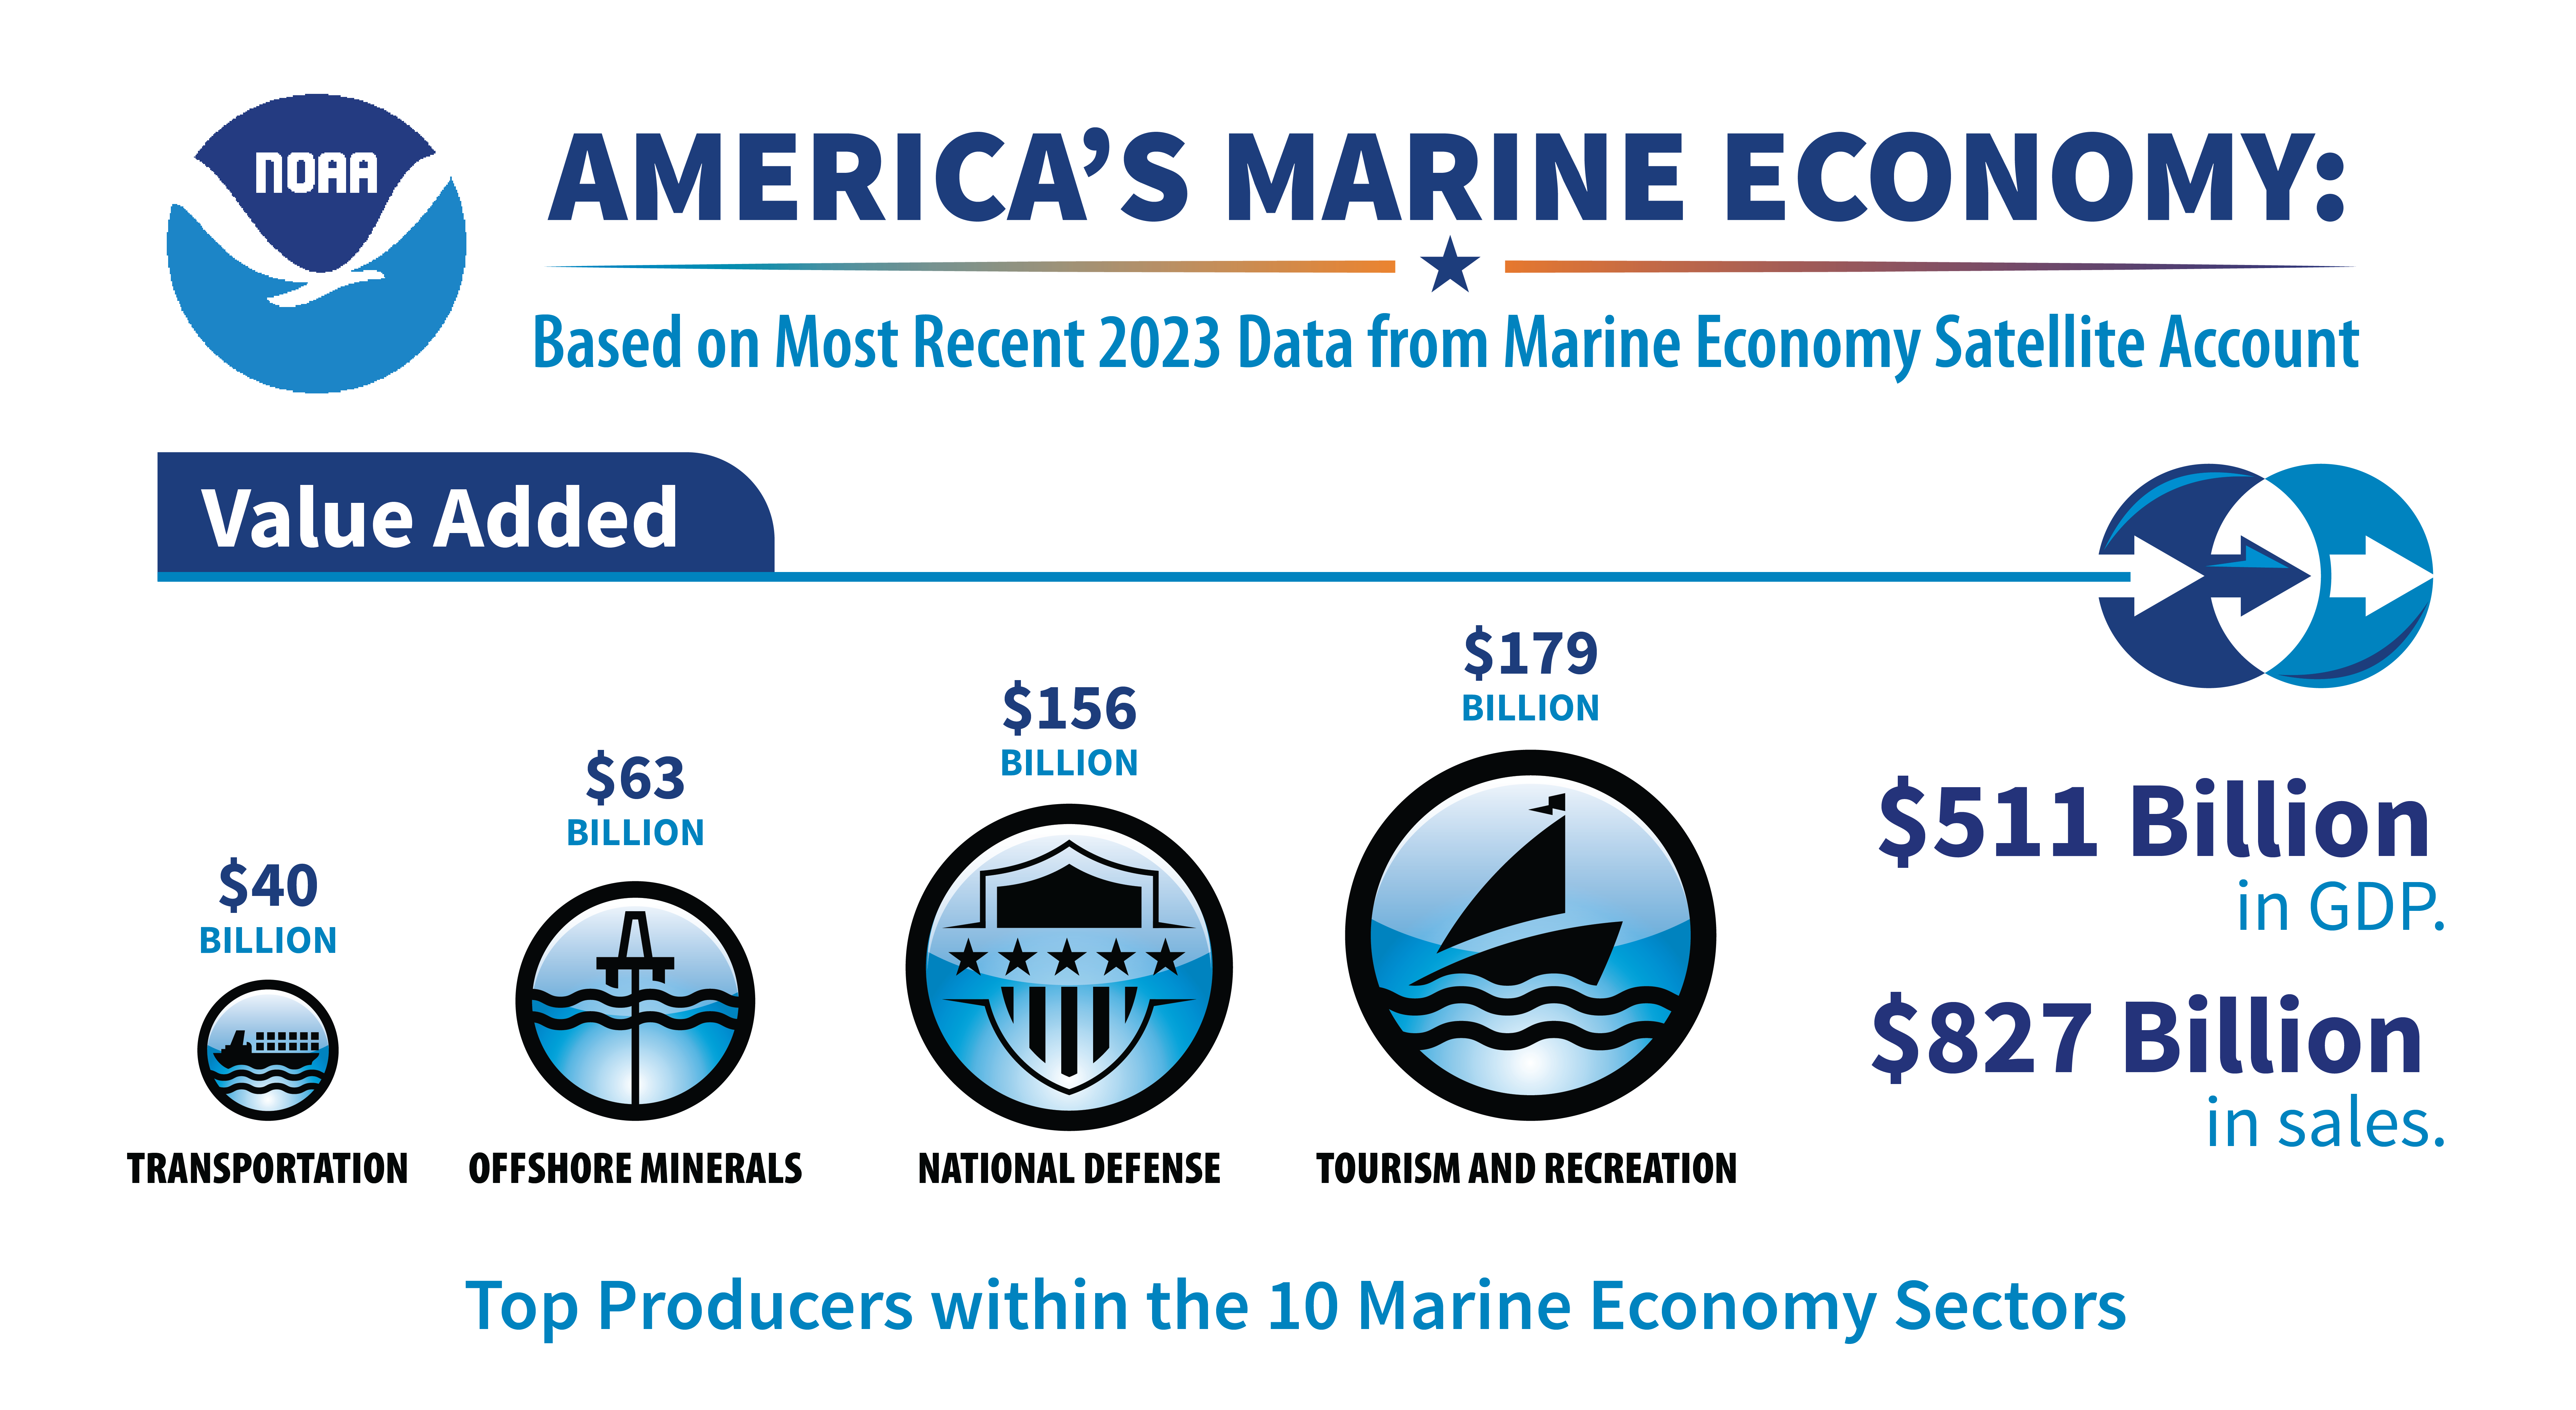
Handout: America's Marine Economy
Data Source: Marine Economy Statistics. The 2022 status is measured by current dollar values unless otherwise noted; the growth values from 2021 are in chained (2017) dollars that have been adjusted for inflation. For marine economy statistics on a state and county level, see the ENOW database.